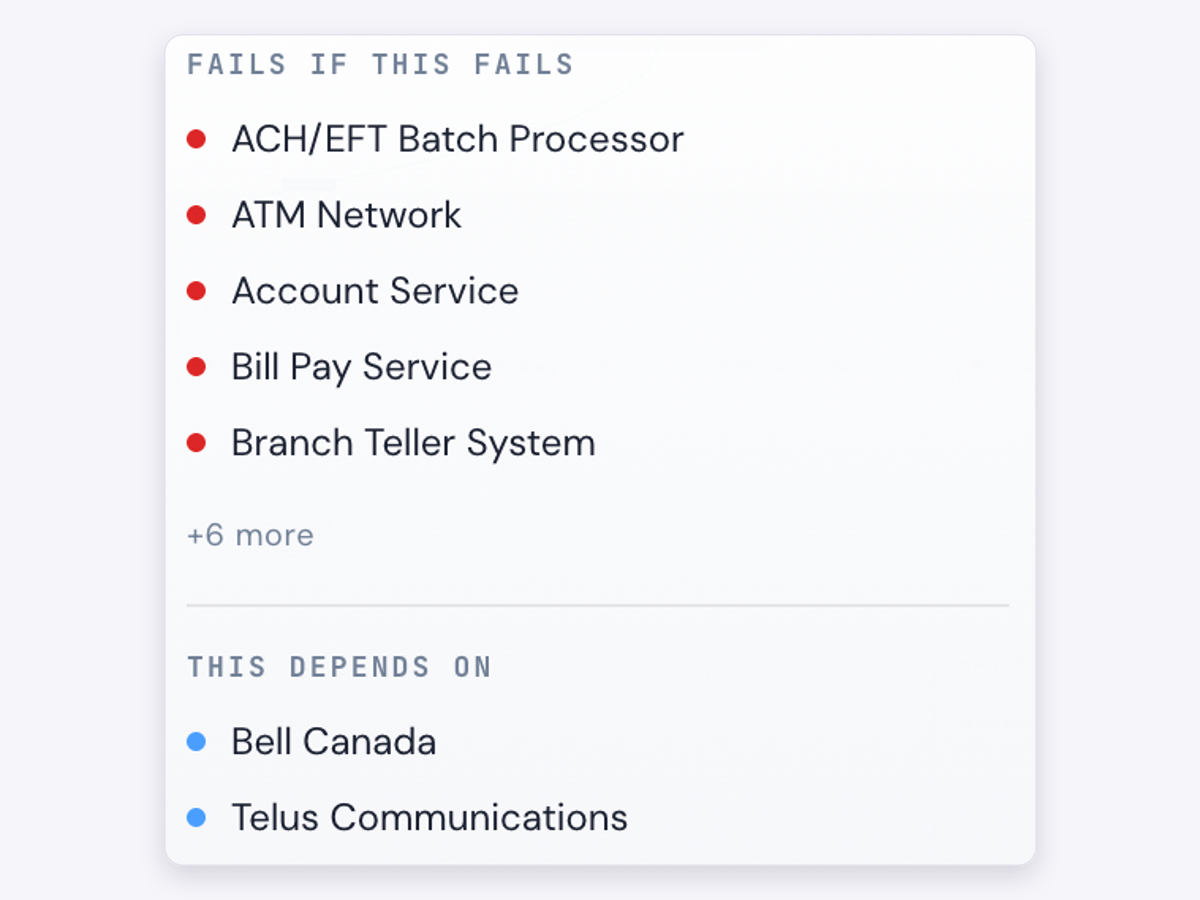
See hidden dependencies clearly
Your services are connected in ways nobody fully tracks. The visual map makes every relationship and single point of failure visible at a glance.
Private beta
Simulate the cascade across your real infrastructure and price the downtime in dollars.
Bring the infrastructure files and diagrams you already have. Failcast imports AWS, Google Cloud, Datadog, Terraform, and Visio to map what is actually running, not what a stale whiteboard says.
Find your weak points in a simulation, not a 3am incident. Every run ends in a prioritized fix list: the SPOF to remove, the backup that's missing, the RTO that won't hold.
Your entire stack on one visual map the whole team can read, with every single point of failure flagged.
Take any service down on purpose and trace the blast radius, minute by minute.
Pre-built outage scenarios for the failures that actually happen: cloud regions, telco carriers, payment rails, identity providers, DNS.
AI suggests likely missing dependencies and resilience gaps for your team to review, including missing backups, unrealistic RTOs, and vendor concentration.
Real product screens: dependency impact, downtime cost, AI suggestions, and board reports.
Your services are connected in ways nobody fully tracks. The visual map makes every relationship and single point of failure visible at a glance.
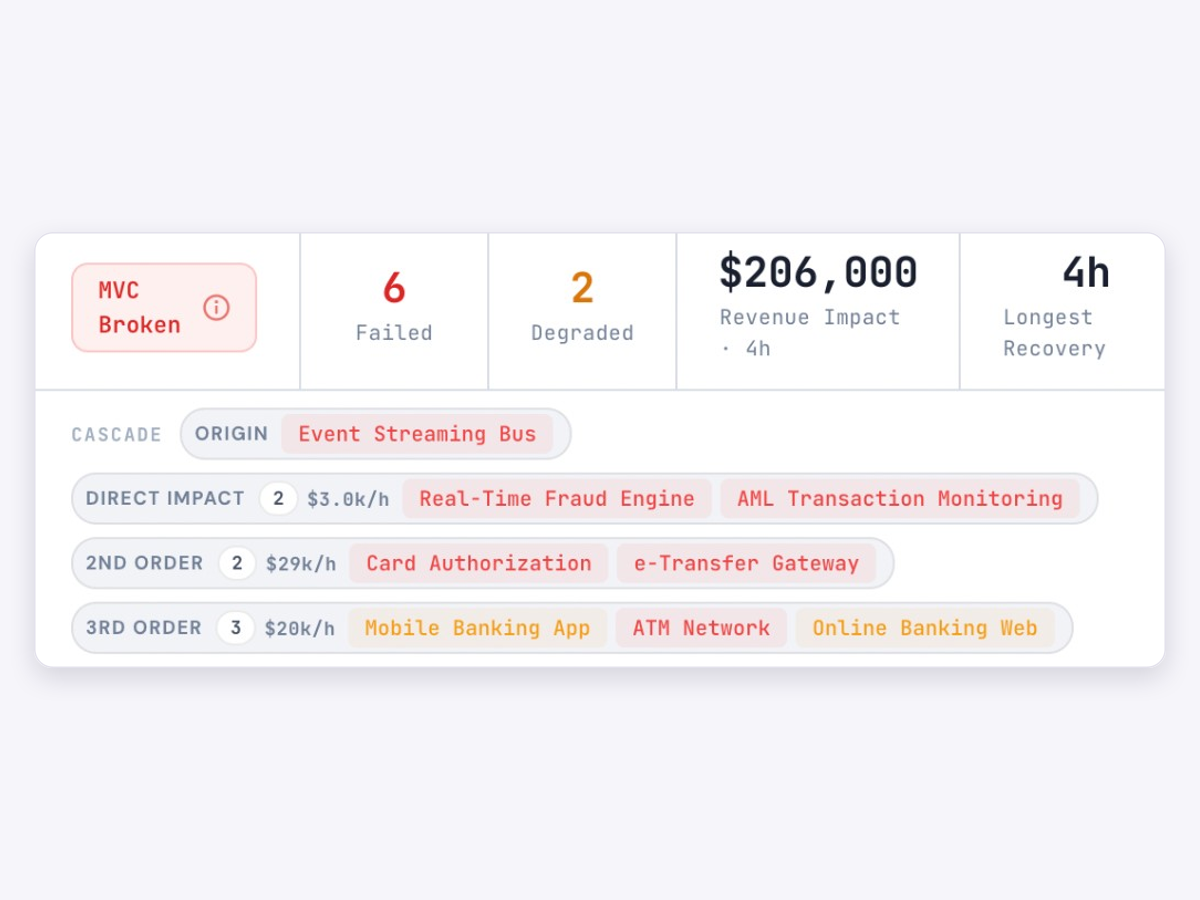
Pick a service and take it down. The report puts a dollar figure on every hour of downtime, so fixes get ranked by what they save.
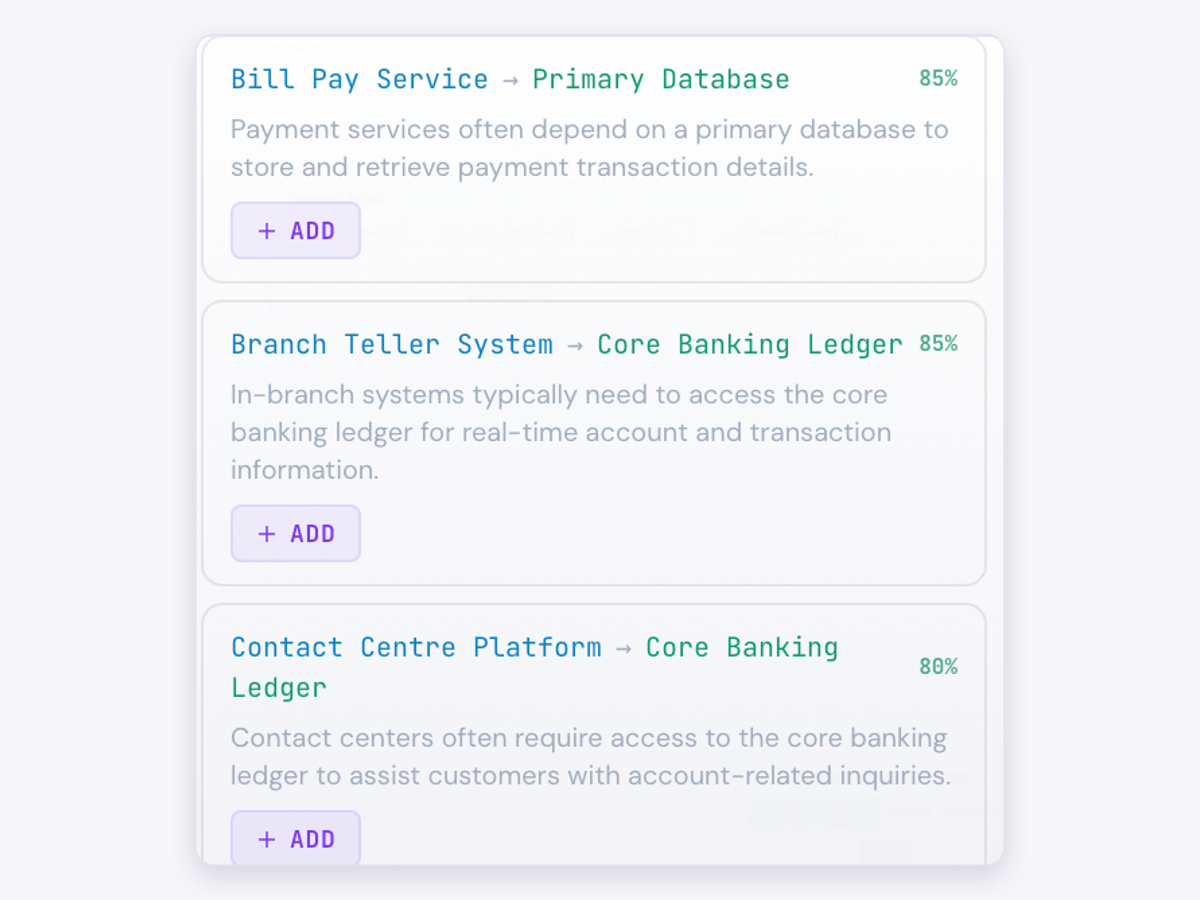
Import Terraform, GCP, or Visio. Failcast builds the map directly from your files, no AI in the parsing path. Once the map exists, optional AI enrichment suggests dependencies your files don't declare and flags weak points like missing backups and risky RTOs, for your team to accept or reject. No third-party AI sees your infrastructure files by default.
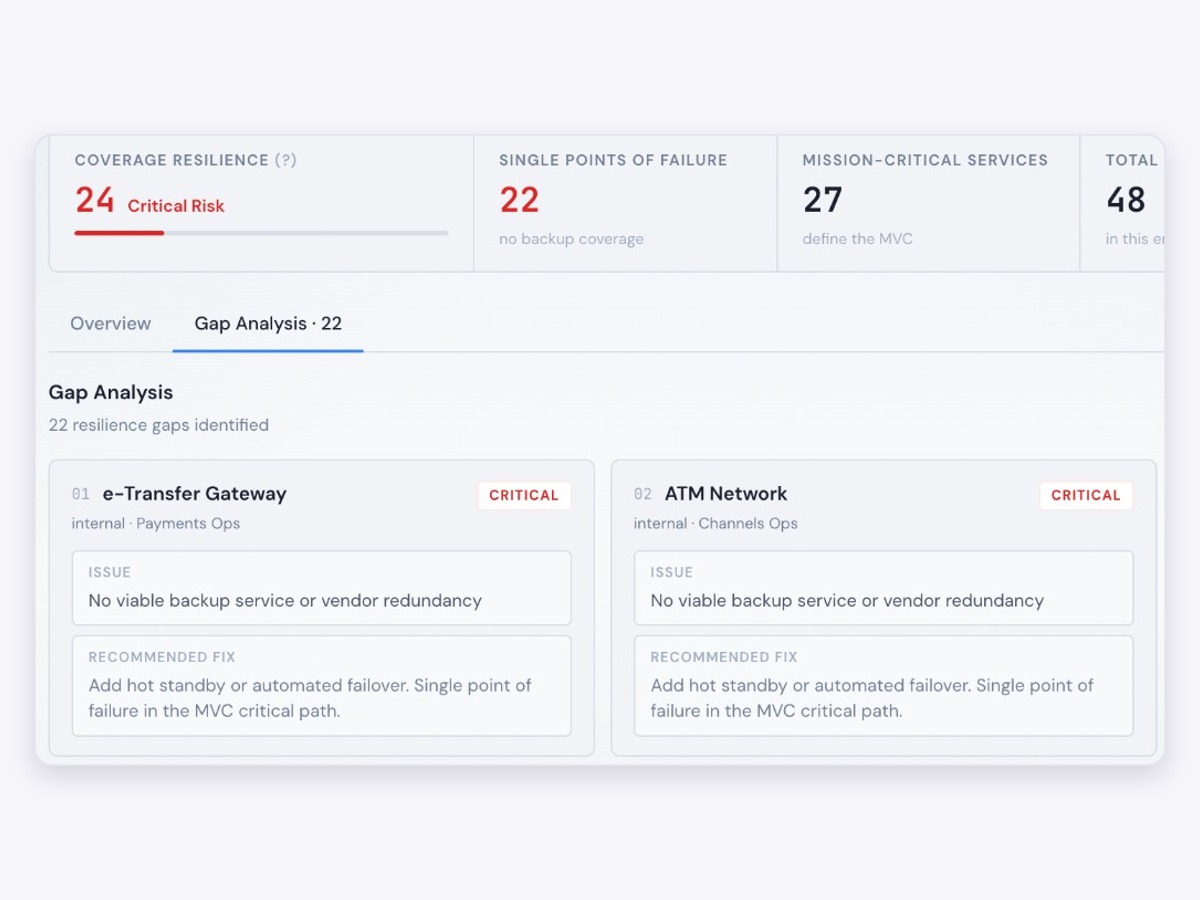
One click turns your map into a resilience report the board can actually read. It covers your overall score, single points of failure, and the critical operations boundary.
Spreadsheets can't simulate cascades. Diagrams go stale. Consultant audits gather dust. Failcast puts dependency mapping, outage simulation, and service-risk analysis in one workflow.
Run real failure scenarios in your browser, no signup required:
Outage post-mortems, compliance guides, and resilience playbooks from the Failcast blog.
Join the private beta waitlist. We'll email you when your access opens.